MLB Home Run Prop Bets: How UK Punters Find the Daily Dinger
Contents
Why the daily dinger market hooked me
The first home run prop I ever cashed was on a left-handed hitter at Yankee Stadium against a right-hander who lived in the upper half of the strike zone, and I spent the fifth inning convinced the price had walked the right way. The second one — same hitter, same park, same handedness split — settled into the right fielder’s glove on a fly ball that travelled 385 feet. That’s home run props in a sentence. The market is brutal, beautiful, and the most popular single-player wager in baseball.
By the time Cal Raleigh hit his sixtieth home run last September, he had become only the seventh player in MLB history to clear 60 in a single season and the first switch-hitting catcher ever to do it. That one number reframed how UK punters approached catcher home run markets for the back half of the year. Lines that opened at +280 in May were quoted inside +180 by August, and the only people consistently beating the close were the ones who had spotted the underlying shift in his pull-side launch profile months earlier.
This is a guide for UK bettors who want to bet MLB home run props with intent rather than hope. The line moves quickly. The variance is enormous. The metrics that genuinely move the needle are narrower than most pundits suggest. Over the next several thousand words I’ll walk you through how the market actually works, which stats predict what, where UK bookmakers price these markets, and the exact workflow I run before placing a single home run pick.
See also: best mlb player prop bets — home run props.
How home run props actually settle
“Will Hitter X hit a home run today, yes or no?” That’s the question every home run prop reduces to, no matter how the bookmaker dresses it up. Markets like “to hit a home run”, “anytime home run scorer” and “over 0.5 home runs” all settle on the same binary, and once you grasp that the rest of the menu falls into place.
A home run requires three things to go right inside roughly four plate appearances: contact, contact in the air, and contact in the air over the fence. Every Statcast metric you’ll see in this guide proxies for one of those three. Exit velocity proxies for raw contact quality. Launch angle proxies for whether the contact gets up at all. Barrel rate combines both — barrels are the subset of batted balls hit at the launch-angle and exit-velocity combination historically associated with a home run.
Sample size is the next thing to internalise. A typical starting hitter sees four plate appearances in a nine-inning game. A leadoff hitter sees four or five. A nine-hole bat sees three, and sometimes only two if the lineup turns over weakly. That’s your at-bat budget, and the smaller the budget, the harder a home run is to bank. A starting catcher who’s getting a planned half-day will sometimes pinch hit late but won’t see his usual four trips. UK books rarely flag rest days on their bet slip, so the lineup card is non-negotiable pre-bet reading.
One more mechanical point: the home run prop usually voids if the player doesn’t take a plate appearance, but most UK books settle the bet as a loser if he records even a single PA and fails to homer. Settlement language varies across operators and across markets, so always read the rules on the slip the first time you bet a new market. Disputes get resolved by the small print, not by what feels fair, and home run markets carry more grey-area edge cases than the moneyline.
The home run market menu worth your stake
The market menu for home runs is wider than most beginners realise, and each variation prices a slightly different question. Let me walk through the ones worth your time.
Anytime home run, also priced as “to hit a home run” or “over 0.5 home runs”, is the headline market. It pays out if the hitter records at least one home run in the game. This is where 80% of the daily-dinger handle settles, and it’s the cleanest entry point for any new prop bettor.
Two or more home runs is a deeper-water market. Implied probability for a top power hitter to clear two is usually inside 5%, so the prices live around +1500 to +2500. The expected value calculation here punishes anyone who treats it as a fun longshot — the math is unforgiving unless your hitter has a genuine multi-homer game profile (flyball rate above 40%, healthy HR per flyball percentage, top-of-the-order lineup spot, and a small home run park).
First home run of the game is a niche market priced like a futures pick, with prices typically in the +800 to +2500 range for individual hitters. There’s variance noise embedded in the order of events that no metric can solve for, which is why I treat this market as entertainment rather than analysis. It’s a fun bet, not a value bet.
Player to hit a home run plus match result combos are increasingly popular in UK bet builders. A team-win-plus-home-run combo prices the home run leg against the assumption that the team wins, which can shift correlation in either direction. I’ll get into combo construction later, but the headline is: these are not two independent legs, and the bookmaker prices that interdependence into the combined number.
Home run brackets — “to hit a home run in innings 1 to 3”, for instance — are niche micro-bets that look enticing but settle the wrong way more often than the price suggests. They reward leadoff and number-two hitters disproportionately because those bats see more early at-bats, and the line factors that in. There’s rarely an edge here unless the bookmaker has been slow to react to a late lineup change.
The market you mostly want is anytime home run, with bet-builder combos as your secondary lane. Everything else is a side dish at best, and several of the side dishes are stale.
Reading the hitter side of the home run line
You can’t bet home run props seriously without understanding how Statcast describes contact quality. The good news is you don’t need a doctorate. Five metrics get the job done, and three of them carry most of the predictive weight.
The most important number on the hitter side is barrel rate, expressed as barrels per batted ball event. A barrel — defined by Statcast as contact that has historically produced at least a .500 batting average and a 1.500 slugging percentage — is the cleanest single-batted-ball indicator of damage. League average runs around 8%. Anything north of 12% flags above-average power. Anything above 15% is elite. Shohei Ohtani’s 2026 season is the modern reference point: he produced 100 barrels in a single year, the fourth-highest single-season total in the Statcast era, paired with a 58.4% hard-hit rate. When a hitter prints those numbers, you don’t need to interrogate his line — you need to interrogate the price.
Hard-hit rate is the secondary indicator. Hard-hit is defined as any batted ball above 95 mph in exit velocity. Kyle Schwarber led MLB last year at 59.6% hard-hit, and the 56 home runs and 132 RBI he hung on the back of that wasn’t a fluke of park or schedule. It was the math doing exactly what it should. Any time I’m looking at a hitter prop, hard-hit rate is the first number I pull alongside the season-long barrel rate, and I want the season-long sample to span at least 200 plate appearances before I trust it as a steady-state signal.
Isolated power (ISO) is the slugging-minus-average shortcut for raw extra-base output. League average sits around .150 to .160, and home run hitters live north of .220. I use ISO as a sanity check rather than a primary input — if barrel and hard-hit say “yes” but ISO is low, something has been suppressing his slugging output and the home run total is likely lagging the underlying contact rather than leading it.
Pull rate matters more than people realise. The fence is closer down the lines than to centre at almost every ballpark. A hitter who pulls 45% of his flyballs earns extra home run probability relative to a hitter who sprays evenly. Pull rate also interacts with the ballpark — Wrigley Field’s wind plays differently for pull-side and oppo-field flies, depending on the day — so a pull-heavy hitter will outperform expected results in some venues and underperform in others.
Flyball-pull combinations are where the most-leveraged edges hide. When a hitter has both a flyball rate above 40% and a pull rate above 40% on flyballs specifically, his home run output scales nonlinearly with park and weather. Those are the names I shortlist on every pre-game slate. The compounding is exactly what the market is slowest to re-price, because public models still treat the two variables as independent additive inputs.
There’s a benchmark cluster I keep on a sticky note next to my monitor: 90 mph average exit velocity, 15% barrel rate, .370 xwOBA across the most recent 40-plate-appearance run. If three of those four flash green over the last 10 days, the hitter is in form regardless of what the box score shows. For deeper reading on the exit velocity component specifically, I keep a separate reference on exit velocity benchmarks for prop betting with the full league-average breakdown and the 2026 leaderboards.
What gets weaker treatment in most public guides is the volatility of these metrics across short samples. A 40-PA window can leave a true 12% barrel hitter posting 6% or 18%, and you’ll see commentators anoint the latter and bury the former on the same evening. Six samples isn’t a signal. Always anchor on the season-long numbers and use the 10-day window only to confirm direction, not to set a baseline.
The pitcher across the diamond
The other half of the equation is the pitcher. Even the loudest hard-hit profile fades against a starter who keeps the ball on the ground or runs an HR per nine innings figure below 0.7. The pitcher’s job in a home run prop is to suppress the air ball, and some pitchers are structurally better at that than others regardless of the hitter standing in.
Three pitcher numbers do most of the work. HR/9 is the headline. Anything below 1.0 is solid. Anything above 1.4 marks a tier of pitchers who feed dingers, and you want hitter overs against them. Groundball rate is the second number; a pitcher running 50% or higher on grounders is structurally fighting the home run market, and you should fade overs against him at almost any line. Hard contact allowed is the third — pitchers whose batted-ball profile includes 40%-plus hard-hit allowed are vulnerable even when their HR/9 hasn’t caught up to the underlying quality.
Pitch mix is the next lever. A pitcher whose primary breaking ball is a curveball with a vertical drop of 60 inches or more generates more swings-and-misses but also more flyballs from hitters who lay off the bottom half. A flat-arc slider against an opposite-handed power hitter is one of the most leveraged home run setups in the sport. UK punters who pay attention to the secondary pitch mix find edges that publicly traded prop grids miss entirely.
There’s an integrity wrinkle worth flagging because it affects pricing on the supply side. When MLB’s commissioner Rob Manfred talks publicly about the betting environment, the line he keeps coming back to is that the crucial issue is access to data. What that means in practice for home run props is straightforward: the books have access to the same Statcast feeds you do, often faster and aggregated more efficiently, and they’ve invested heavily in their own pricing models since the post-2026 integrity wave. The price you see is a sharper price than it was three years ago, and that raises the bar for finding an edge.
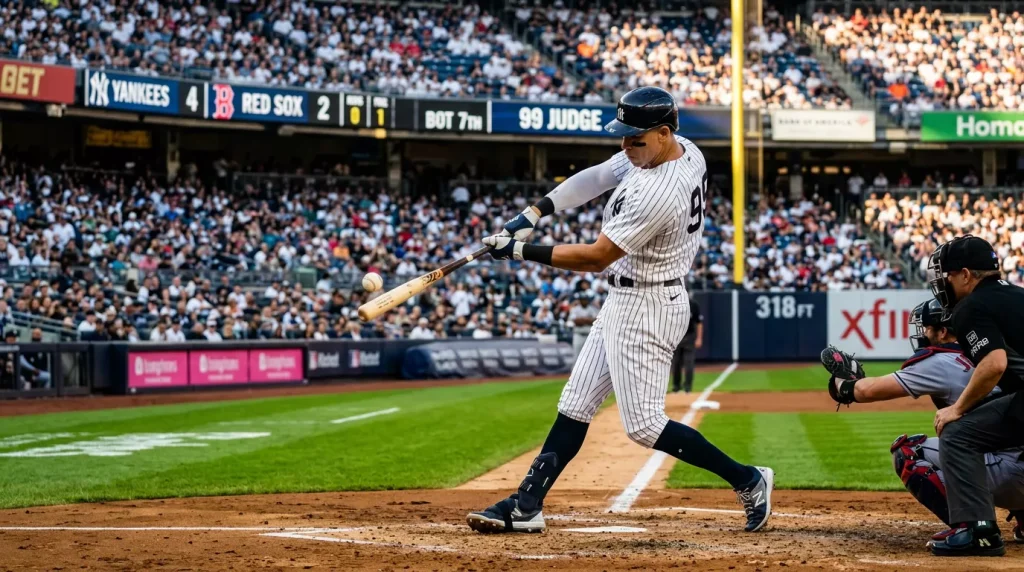
Park-handedness splits sit beneath the matchup. Coors Field plays huge for everyone. Petco plays small for left-handed power. Yankee Stadium has the short right-field porch that helps left-handed pull hitters disproportionately. A left-handed hitter facing a right-handed pitcher in Yankee Stadium at 25 degrees Celsius with the wind blowing out is a fundamentally different probability question than the same hitter facing the same pitcher in San Francisco at 14 degrees with the marine layer settling in. Same names, opposite probability surfaces.
Finally, fatigue and recent workload move the line. A starter coming off a 105-pitch outing on short rest is more likely to leave a hanging breaking ball at 88 mph somewhere over the heart of the plate in the fifth inning, and that’s the pitch that gets crushed. Pitch counts and rest days aren’t sexy data, but they pay rent.
My pre-slate workflow before any home run prop goes in
Most home run prop losers are losing on process, not picks. Here’s the workflow I run every game day, and it takes around 35 minutes for a typical 10-game slate.
Step one: lineups. I check confirmed lineups around 60 to 90 minutes before first pitch. Anything earlier is projection. If a star hitter is not confirmed in his usual spot, I drop the prop. UK books usually don’t void the bet for an absent player — they just settle it as a loser when no plate appearance happens. The exception is when the operator has a specific lineup-void rule on home run markets; rare, but worth checking once per book.
Step two: weather. Temperature, wind direction, wind speed, humidity. The shortcut is: every 10 degrees Fahrenheit warmer adds roughly one foot of carry on a flyball, and a 10 mph tailwind to centre field adds another four to six feet. A 12 mph wind blowing in from the pull-relevant side is enough to kill a marginal home run prop. Wind direction matters more than wind speed in most cases — a strong wind across the field that doesn’t align with anyone’s pull path is closer to neutral than to suppressive.
Step three: ballpark. Three-year rolling park factors for home runs, broken out by hitter handedness. Coors, Great American Ball Park, and Yankee Stadium are the loudest pro-HR venues, while Oracle Park, Petco Park, and Tropicana Field suppress the long ball. The exact factor matters less than knowing which bucket the venue lives in.
Step four: hitter form. I look at the most recent 10-game window for barrel rate, hard-hit, and average exit velocity. The benchmark cluster worth memorising: 90 mph EV, 15% barrel rate, and .370 xwOBA over a 40-plate-appearance stretch is the bar for a hitter in genuine form. The hitter doesn’t have to clear all three to make the shortlist — clearing the majority of them with the others trending in the right direction is enough to confirm a hot read.
Step five: pitcher matchup. HR/9, groundball rate, pitch mix, recent rest. Cross against the hitter’s pull side. A right-handed pitcher with a 55% groundball rate is bad news for any flyball pull hitter you’ve shortlisted, even if his ERA looks generous.
Step six: price. I open at least three UK operators side by side and shop the line. The difference between +280 and +260 across hundreds of bets over a season is the difference between profitable and break-even. Line shopping is the single highest-ROI habit a prop bettor can build.
Step seven: I write the bet down with a one-sentence thesis. If I can’t articulate the why in a sentence, the bet doesn’t go in. That last filter is the cheapest in my entire process and the one most punters skip. The discipline of forcing a verbal thesis is what protects you from betting on a vibe.
How UK books quote home run markets
UK bookmakers approach MLB home run markets differently from their American counterparts, and the gap is wider than most new punters realise.
The first thing to know is that UK books quote in fractional odds, or in decimal if you toggle the setting, but not in American format by default. A +280 American line is 11/4 fractional, or 3.80 decimal. The implied probability of that price is 26.3%. Quick mental conversion comes with practice, but the headline lesson is that fractional and decimal both reveal the implied probability more directly than the American format does, and that’s a quiet advantage for European bettors learning to think in true probability rather than payout shape.
Market depth varies. The largest UK operators price anytime home run for every starting hitter on most game days, but smaller books only price marquee names. For featured matchups — Yankees, Dodgers, Red Sox, Mets — you’ll see lines for the entire starting nine. For Mariners versus Athletics on a Tuesday in May, you might find lines only for the lineup’s three biggest power threats. Schedule your slate-building around that reality and don’t expect parity across operators.
Live streaming changes the value calculation. bet365, for instance, offers live MLB streaming to accounts with a funded balance or a bet placed in the last 24 hours, subject to operator terms. Watching the game live lets you react to lineup news, weather changes, and pitch-count fatigue in real time, and it improves in-play prop value substantially. If you’re betting MLB props seriously in the UK, streaming access is a meaningful structural advantage that US punters lose at the geographic border of state-licensed apps.
Best Odds Guaranteed (BOG) on home run props is patchier than on horse racing or football. Many UK operators apply BOG only to the moneyline and run line, not to player props. Always check operator terms — the value of BOG on a +250 home run prop that drifts to +320 by first pitch is enormous over a season, and operators that price it in for prop markets are worth weighting upward in your rotation.
Bet builders are the UK answer to American same-game parlays. They allow you to combine two or more legs from the same game with correlation-aware pricing built in. I’ll cover construction further in a dedicated piece, but the basic mechanics are: each leg’s implied probability is multiplied, with a correlation adjustment baked in by the operator. The transparency of that adjustment varies by book.
A final note on stake handling: free bets typically don’t return the stake portion, and bonus money has wagering requirements that interact with prop markets in non-obvious ways. Read the small print on every promotion you accept before you place the qualifying bet.
The mistakes I see UK punters repeat
After nearly a decade of betting these markets, the recurring losing patterns I see are usually process errors rather than analytical ones. Here are the most expensive.
The first is chasing the big name. Aaron Judge will hit home runs. Cal Raleigh will hit home runs. Shohei Ohtani will hit home runs. The market knows this, and the price embeds it. A line of +200 on Judge to homer at home against a generic right-hander isn’t an opportunity — it’s a fair price, and possibly a juiced one. You make money on these markets by finding the +400 hitter whose underlying barrel and pull profile justifies +250, not by stacking up the obvious names at fair value. The big names are bait for casual handle.
The second is ignoring weather until the morning of the game. Wind direction in particular gets baked into the line on the day, but the early line — overnight, or the morning before first pitch — often lags the forecast. If you have a workflow that flags pro-HR weather six to eight hours before first pitch, you get the price first, and that’s the closing-line value that determines whether you’re a winning bettor over the long haul.
The third is over-relying on hot-streak narratives. Pundits will tell you a hitter has homered in three straight games, and that this means something. It doesn’t. Home run runs come and go on small-sample randomness, and the second a story-driven prop goes in front of the casual public, the line moves the wrong way. Underlying contact metrics matter; recent home run totals don’t, beyond what they reveal about underlying contact.
A fourth is worth mentioning briefly: betting home run props in a bet builder without considering correlation. If you stack two home run props from the same game, the bookmaker prices them as if they’re loosely correlated — both depend on the same pitcher’s ability to limit flyballs — which means the combined price often eats more value than you realise. Treat correlated legs with caution and always sanity-check the implied combined probability against the rough product of the individual leg probabilities. If the combined line is much shorter than that product, the operator is pricing in correlation aggressively, and you’re paying for it.
The common thread across all four mistakes is impatience. Home run props reward the patient bettor who’s willing to wait for the right name, the right park, the right pitcher, and the right price to align. They punish anyone in a hurry to find action.
See also: barrel rate for MLB home run props and what it reveals.