Exit Velocity Benchmarks for MLB Player Prop Betting
Contents
Why exit velocity changed how I price hitter props
The first time I ignored exit velocity, I lost three weeks of profit in a single Tuesday. The hitter in question was raking — a tidy stretch of multi-hit nights, a couple of homers, the kind of form a casual punter sees and follows. I followed it. What I had not bothered to check was that his average exit velocity had been bleeding lower for ten days. The hits were soft; the homers were wind-aided. The form was a mirage.
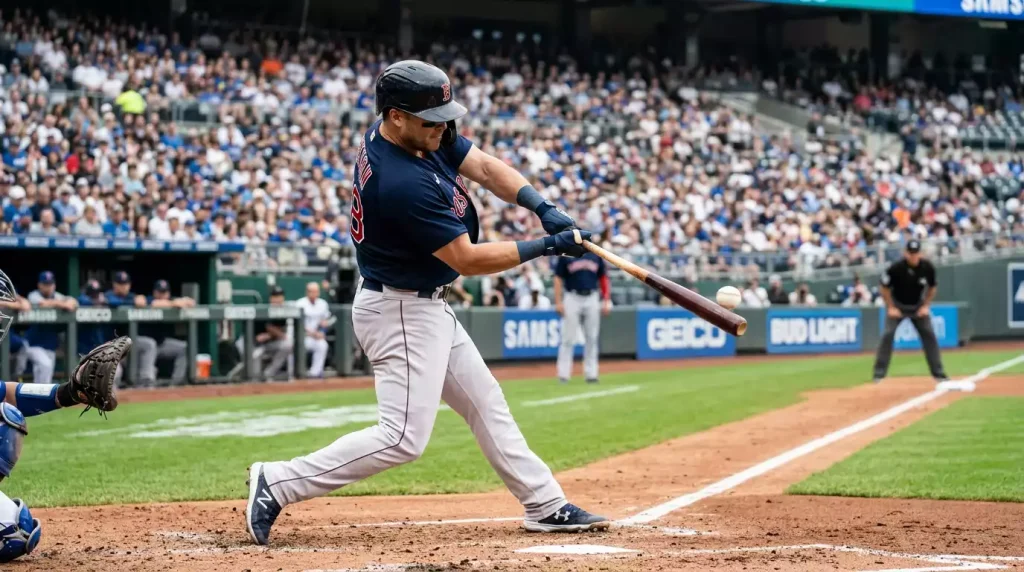
Exit velocity is the metric that separates results from process. It tells you how hard a ball came off the bat, in miles per hour, regardless of what happened next. A 105 mph line-drive at a fielder is a better signal than a 78 mph bloop hit that drops in. For prop bettors, that distinction is everything. We are not paid for the past; we are paid for the next bet. Exit velocity is one of the cleanest forward-looking signals Statcast offers.
See also: best mlb player prop bets — exit velocity.
What exit velocity actually measures
Imagine a radar gun pointed at the ball the instant it leaves the bat. That is what exit velocity is — the speed of the ball, measured in mph, the moment contact ends. Statcast tracks it on every batted ball, every park, every night. The metric does not care about the result. It does not know whether the ball became a homer, a flyout, or a single. It only knows how hard it was hit.
From that one number, a small family of derivatives appears. Hard-hit rate measures the percentage of a hitter’s batted balls that exceed 95 mph. Maximum exit velocity flags the single hardest contact in a window. Average exit velocity smooths everything into a season figure. Each one tells you something slightly different. For prop research, I lean hardest on average and hard-hit rate, because they describe the typical batted ball, not the outlier.
What exit velocity does not measure is also worth saying out loud. It says nothing about launch angle, nothing about pitch type, nothing about pull-side tendency. A hitter can post elite EV and still be useless for home run props if his launch angle is wrong. Treat EV as one input, not the whole answer.
Where the league sits and where the line should hover
The numbers I quietly memorise and you should too. Average exit velocity across qualified MLB hitters tends to land just under 90 mph. The benchmark for a hitter in genuine form sits above 90 mph on average over a recent window of 40 or more plate appearances, with a hot-form profile usually combining exit velocity above 90 mph, a barrel rate north of 15 per cent, and an xwOBA above 0.370 over that same 10 to 15 day stretch. That is the rough signature of a hitter the market should be afraid of.
Top-tier hitters do not just clear those bars; they live north of them. Kyle Schwarber led MLB in hard-hit rate at 59.6 per cent in the 2026 season — nearly six out of every ten batted balls coming off his bat at 95 mph or harder. That is the kind of foundation that supports an aggressive home run prop, even on a quiet night for results, because the underlying contact quality has not gone anywhere.
Below 88 mph average is where I start treating a hitter as a fader rather than a backer for power props. The market often lags those declines by a week or more, which is the gap I am trying to live in.
The 2026 leaders and what they tell us going forward
I keep a small list of names taped to the back of my notebook from the previous season’s leaderboard, because those names dictate which hitters I assume have a true edge until the new season tells me otherwise. The 2026 standout was Shohei Ohtani, who racked up 100 barrels — only the fourth time anyone has hit triple digits in barrels in the Statcast era — alongside a hard-hit rate of 58.4 per cent. That is not just a great year. That is one of the loudest batted-ball seasons in the last decade.
Schwarber’s 59.6 per cent hard-hit rate is the other 2026 anchor. He paired it with 56 home runs and 132 RBI, which is the kind of profile that lets you back almost any total bases or HR prop with the matchup as the only filter you need to apply. When the underlying EV signal is that loud, weak nights are usually noise, not warning.
What I tell people who ask me about following last year’s leaders: do not assume the order holds, but assume the names belong on the shortlist. Ohtani and Schwarber will not be near the top by accident. Hitters with elite EV tend to stay elite for multi-year windows, because bat speed and physical strength do not collapse overnight. The risk is overpaying for a name; the value is recognising which names have not lost their underlying engine.
Turning EV data into a bet you can actually place
Here is the workflow I run before any hitter prop, and it takes about ninety seconds once you have the bookmarks. Pull the hitter’s rolling 15-day average exit velocity. Cross-check his hard-hit rate against the season figure to see whether form is rising, flat, or falling. Then look at the opposing pitcher’s allowed average exit velocity — yes, that exists, and it is the most underused number in prop research.
A hitter at 92 mph average EV facing a pitcher who allows 91 mph contact is a stack signal. A hitter at 92 mph facing a pitcher who allows 86 mph is a closer call than the names alone suggest. The book is usually pricing the names; you are pricing the underlying physics.
One former investigations lead at IC360 put the wider context bluntly. We’re in a bit of a watershed moment this year. Many of the cases involve individuals allegedly manipulating their performances so that bettors could wager on their statistics, whether that be pitches or points scored. That has increased scrutiny on player prop bets, which can be easier to fix because they are dependent on individual outcomes.
The integrity story is now part of the daily air around props, and EV-driven research is one of the cleanest, hardest-to-game inputs we have left. A bookmaker cannot fake a batted-ball reading from a radar feed without being caught immediately.
When the EV signal is strong and the matchup amplifies it, the prop is usually live. When the signal is weak, no amount of name recognition saves the bet. For a closer look at how EV pairs with the metric that translates raw contact into runs, my walkthrough of barrel rate for MLB home run prop bettors is the next stop. The two numbers belong on the same page.
See also: launch angle for MLB home run props as companion data.
Building the habit, not chasing the spike
The biggest mistake I see new prop bettors make with exit velocity is treating it as a hot-streak alarm. They see one 113 mph line-drive on a highlight and assume the hitter is on. That single number is anecdote, not data. The disciplined approach is the rolling window — 40 plate appearances minimum, 10 to 15 days of context — and a willingness to hold off when the signal is mixed. EV rewards patience more than reflexes.